The World Health Organization has asserted that well-being is a communal construct that exists at the intersection of health, equity, and sustainability for persons, places, and the planet. Student well-being can be measured in many ways. Within the USC Well-being Collective we are currently focused on health and equity of persons and places. Here, we aim to deeply understand both quantitative population-level data and qualitative data from people’s lived experiences
The USC Well-being Collective collects data in many ways including an annual Student Well-being Index Survey (SWIS). Each year, thousands of students participate in this comprehensive survey which covers at least six core categories of interest, which are reflected in this section.
- Sense of Belonging
- Fairness and Equity
- Flourishing
- At-risk Drinking
- Sexual Violence
- Upstanding Behaviors
Thanks to our students’ participation, we are able to gather and report on the state of well-being at USC. If you represent an academic or administrative unit and are interested in learning more about our survey results, please contact us. To read more about our methodology, please click here.
Eight Measures of Progress
Below we share our key performance indicators (KPIs). These progress markers were created by members of the student community and participating Collective partners to regularly report and share with the whole USC community. As partners align towards the common agenda and drive towards our desired outcomes, the KPIs serve as a shared measurement of progress.
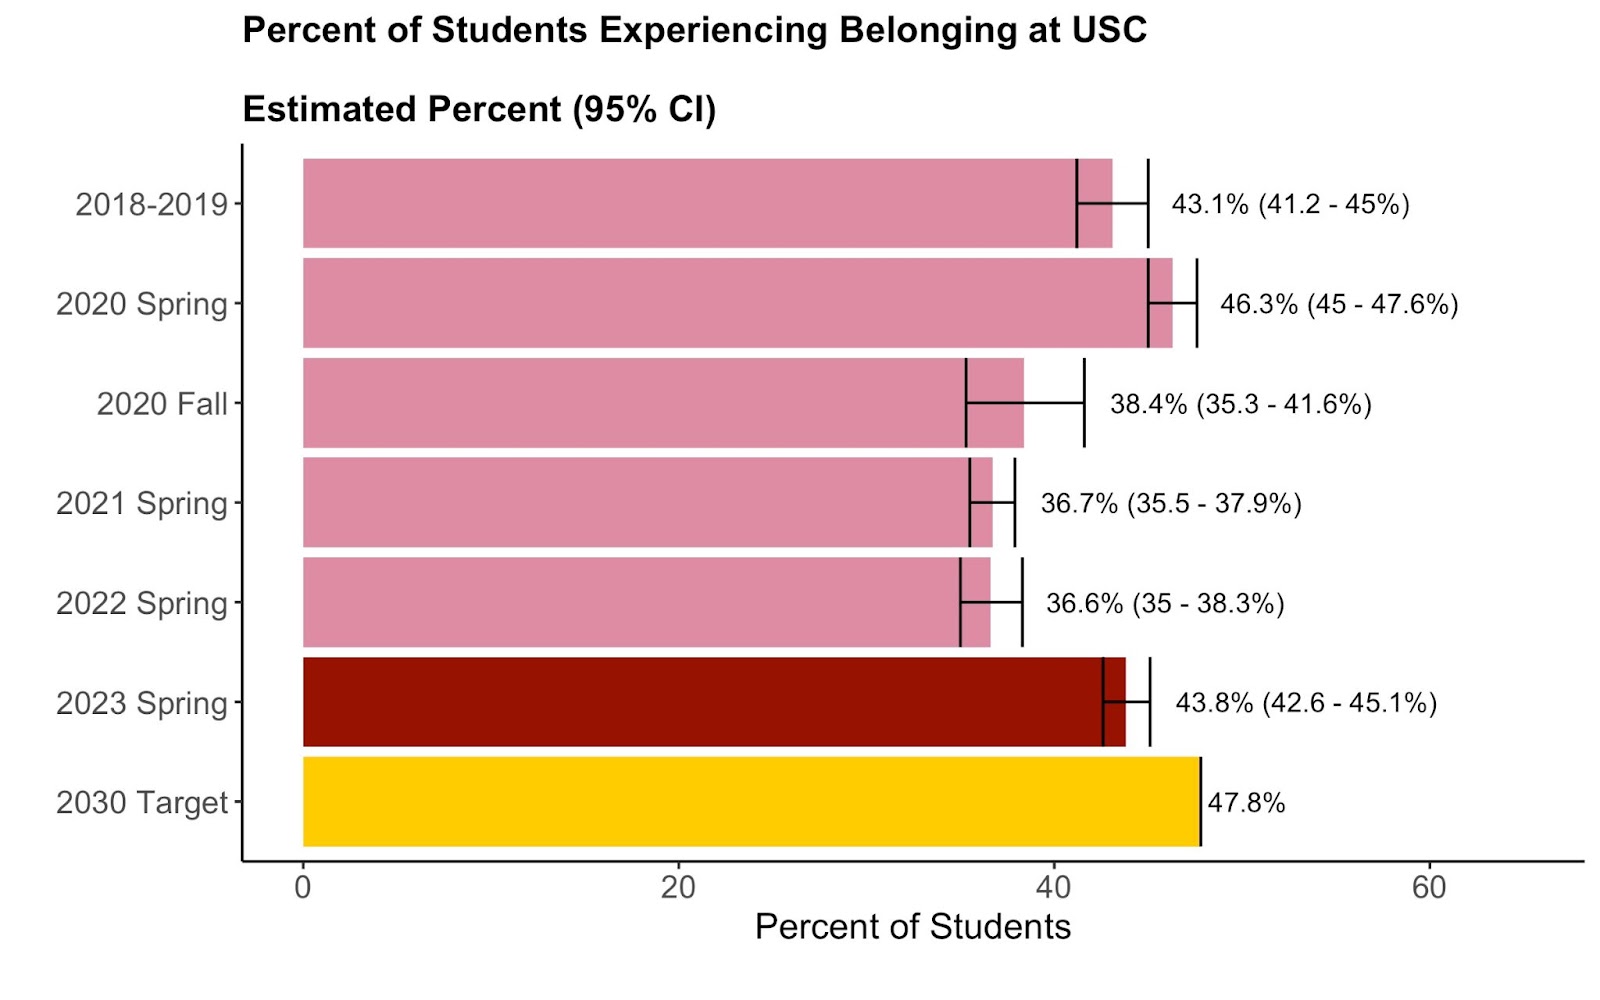 Alt Text: Figure of the Percent of Students Experiencing Belonging at USC, displaying the Estimated Percent and 95% Confidence Interval. For 2018-2019, the estimated percent was 43.1, and the 95% Confidence Interval was 41.2 to 45. For 2020 Spring, the estimated percent was 46.3, and the 95% Confidence Interval was 45 to 47.6. For 2020 Fall, the estimated percent was 38.4, and the 95% Confidence Interval was 35.3 to 41.6. For 2021 Spring, the estimated percent was 36.7, and the 95% Confidence Interval was 35.5 to 37.9. For 2022 Spring, the estimated percent was 36.6, and the 95% Confidence Interval was 35 to 38.3. For 2023 Spring, the estimated percent was 43.8, and the 95% Confidence Interval was 42.6 to 45.1. The 2030 Target is 47.8 percent. | 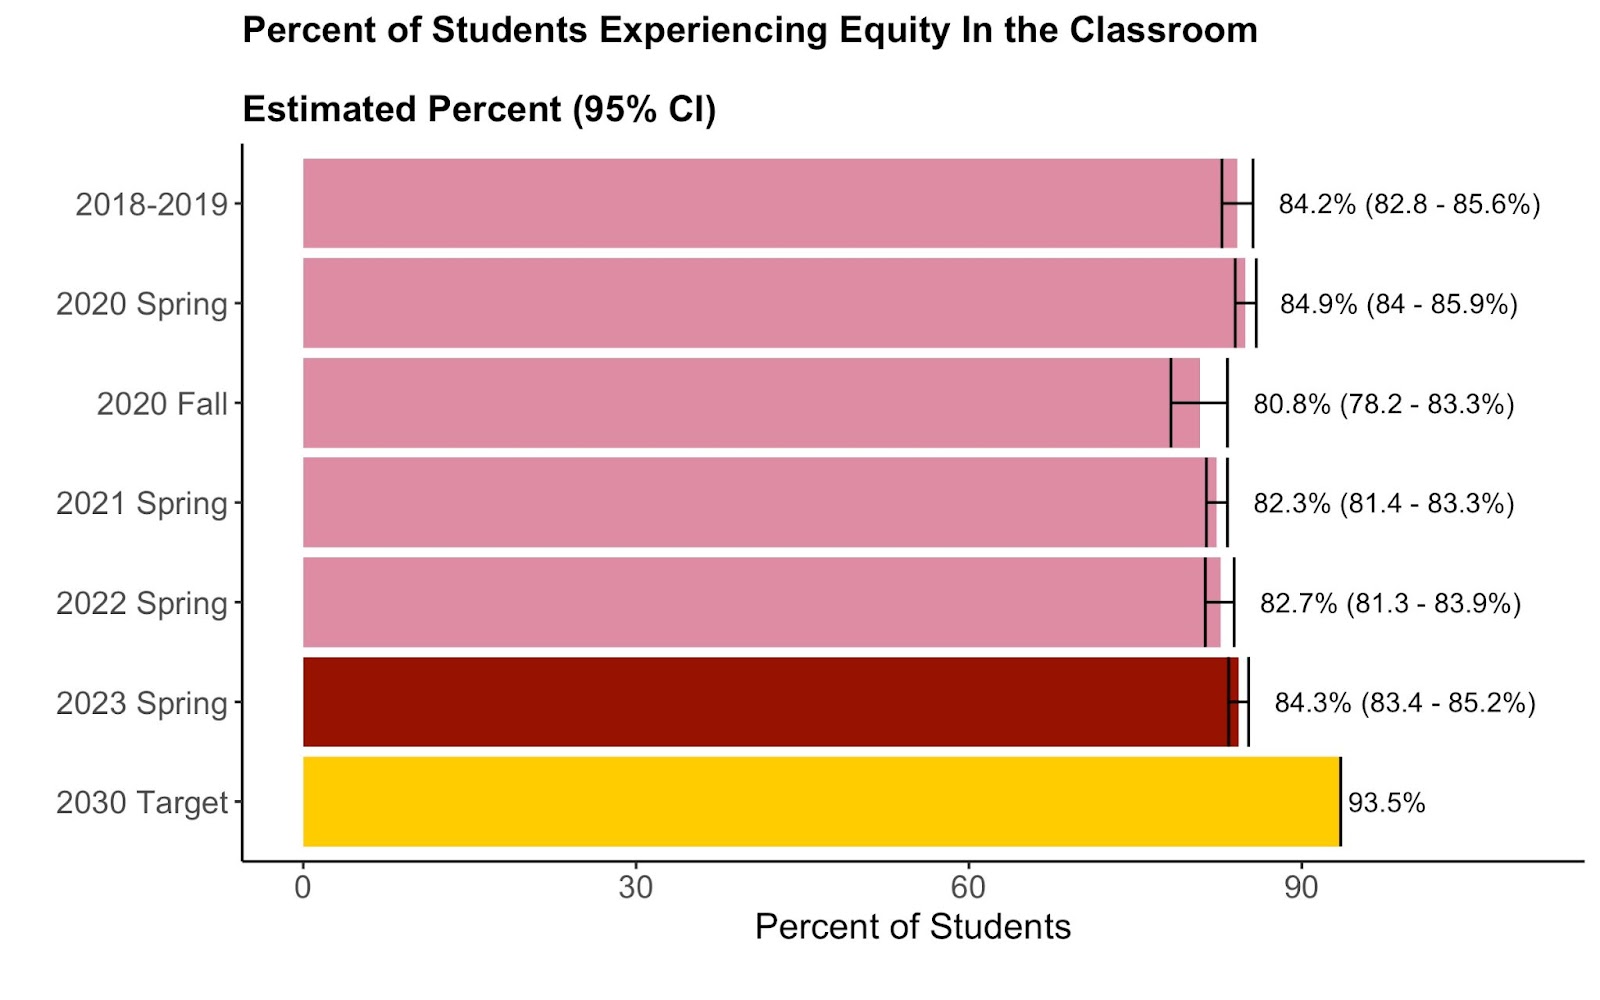 Alt Text: Figure of the Percent of Students Experiencing Equity In the Classroom, displaying the Estimated Percent and 95% Confidence Interval. For 2018-2019, the estimated percent was 84.2, and the 95% Confidence Interval was 82.8 to 85.6. For 2020 Spring, the estimated percent was 84.9, and the 95% Confidence Interval was 84 to 85.9. For 2020 Fall, the estimated percent was 80.8, and the 95% Confidence Interval was 78.2 to 83.3. For 2021 Spring, the estimated percent was 82.3, and the 95% Confidence Interval was 81.4 to 83.3. For 2022 Spring, the estimated percent was 82.7, and the 95% Confidence Interval was 81.3 to 83.9. For 2023 Spring, the estimated percent was 84.3, and the 95% Confidence Interval was 83.4 to 85.2. The 2030 Target is 93.5 percent. |
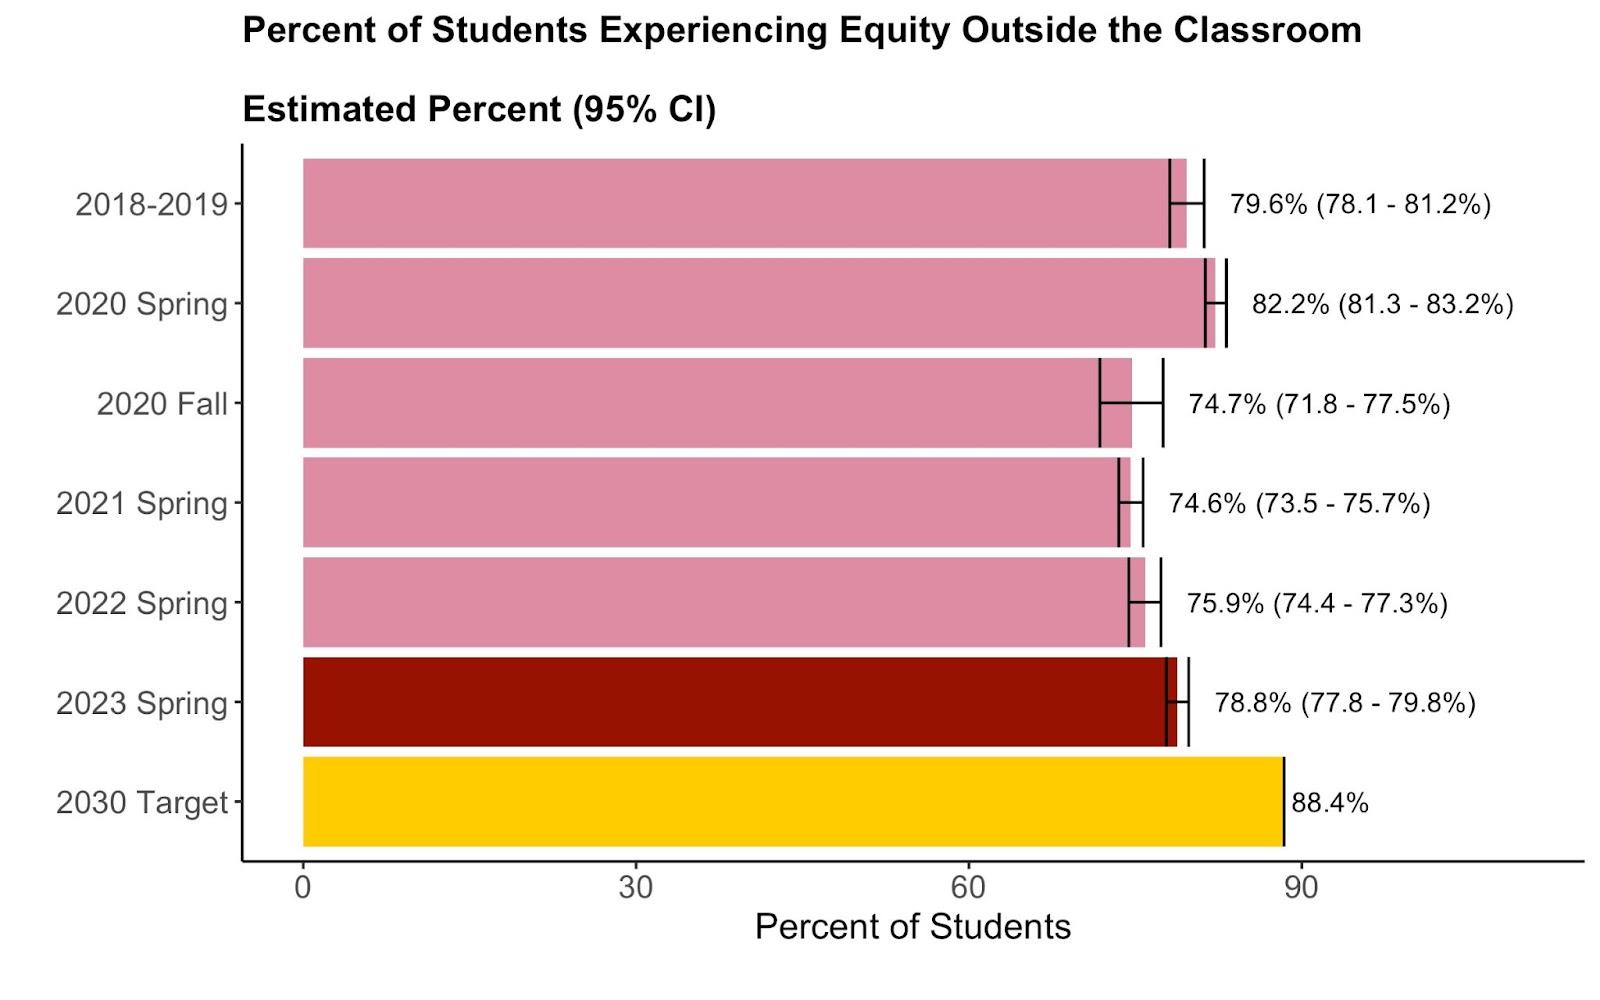 Alt Text: Figure of the Percent of Students Experiencing Equity Outside the Classroom, displaying the Estimated Percent and 95% Confidence Interval. For 2018-2019, the estimated percent was 79.6, and the 95% Confidence Interval was 78.1 to 81.2. For 2020 Spring, the estimated percent was 82.2, and the 95% Confidence Interval was 81.3 to 83.2. For 2020 Fall, the estimated percent was 74.7, and the 95% Confidence Interval was 71.8 to 77.5. For 2021 Spring, the estimated percent was 74.6, and the 95% Confidence Interval was 73.5 to 75.7. For 2022 Spring, the estimated percent was 75.9, and the 95% Confidence Interval was 74.4 to 77.3. For 2023 Spring, the estimated percent was 78.8, and the 95% Confidence Interval was 77.8 to 79.8. The 2030 Target is 88.4 percent. | 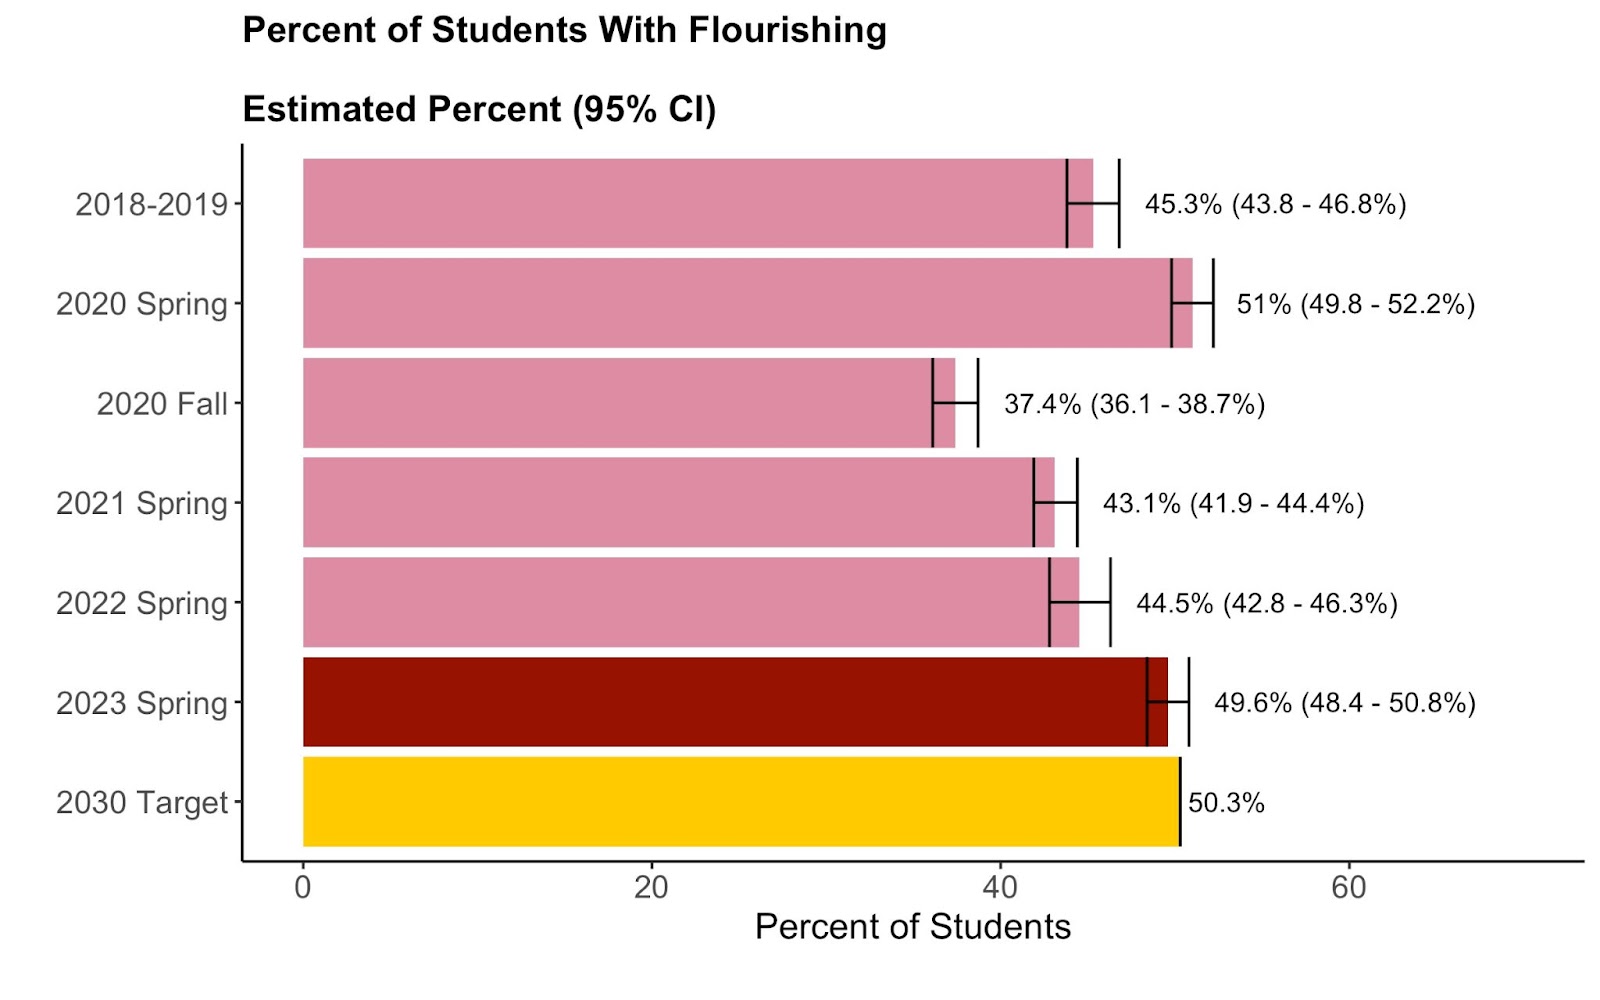 Alt Text: Figure of the Percent of Students With Flourishing, displaying the Estimated Percent and 95% Confidence Interval. For 2018-2019, the estimated percent was 45.3, and the 95% Confidence Interval was 43.8 to 46.8. For 2020 Spring, the estimated percent was 51, and the 95% Confidence Interval was 49.8 to 52.2. For 2020 Fall, the estimated percent was 37.4, and the 95% Confidence Interval was 36.1 to 38.7. For 2021 Spring, the estimated percent was 43.1, and the 95% Confidence Interval was 41.9 to 44.4. For 2022 Spring, the estimated percent was 44.5, and the 95% Confidence Interval was 42.8 to 46.3. For 2023 Spring, the estimated percent was 49.6, and the 95% Confidence Interval was 48.4 to 50.8. The 2030 Target is 50.3 percent. |
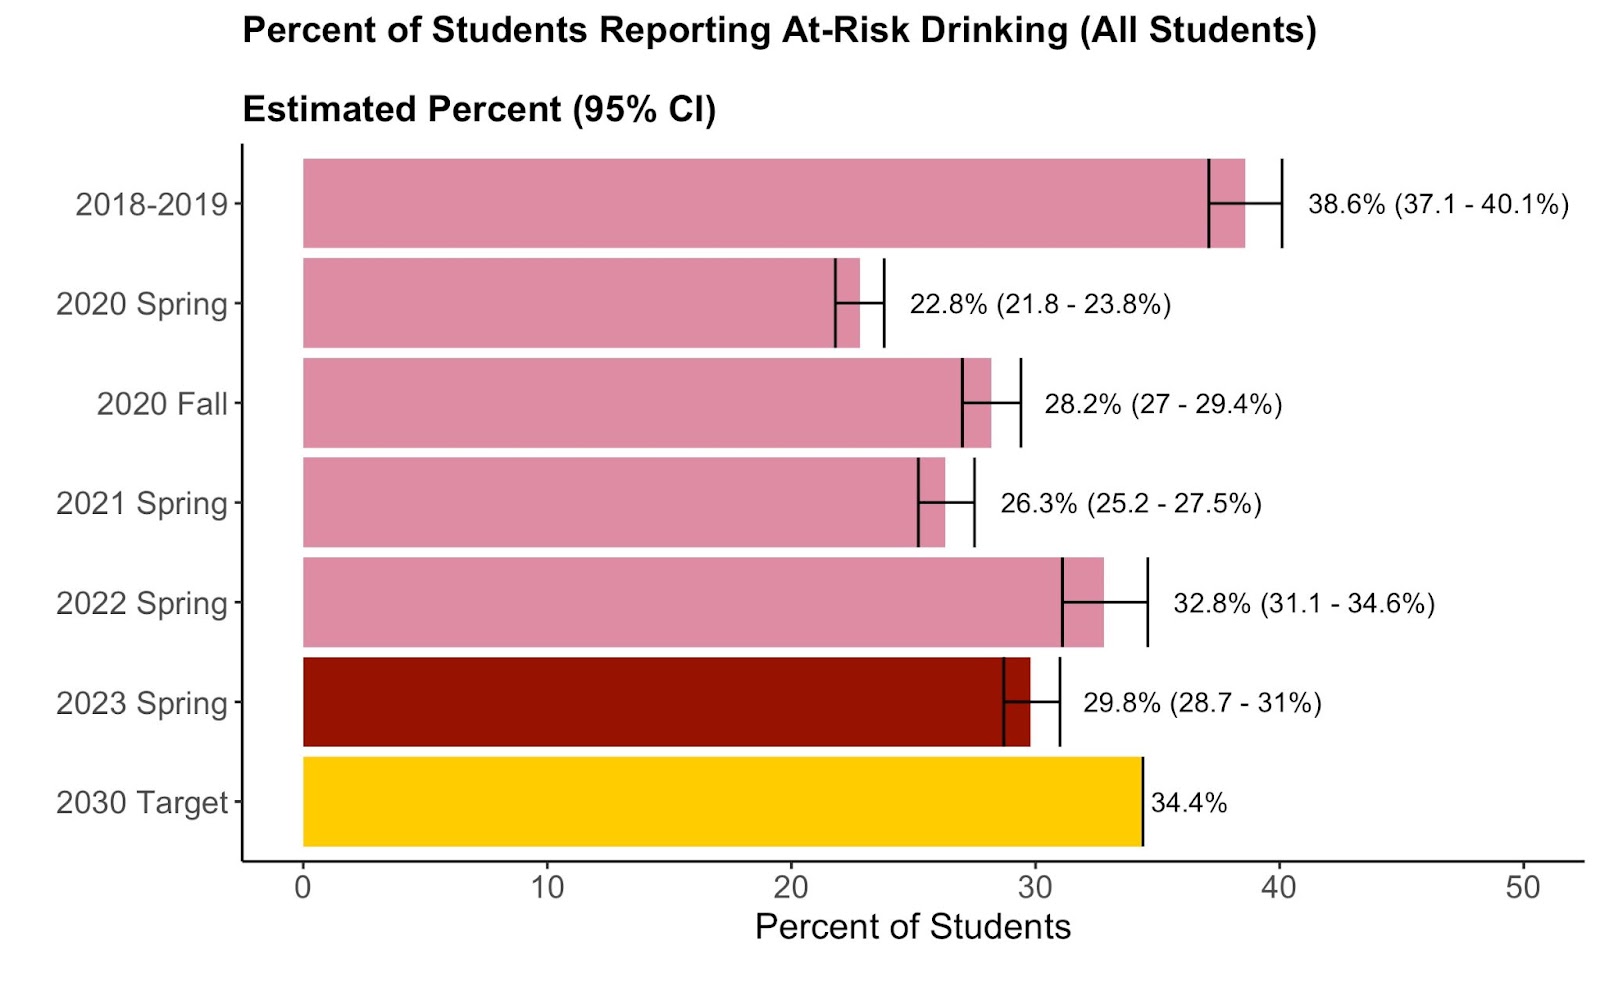 Alt Text: Figure of the Percent of Students Reporting At-Risk Drinking (All Students), displaying the Estimated Percent and 95% Confidence Interval. For 2018-2019, the estimated percent was 38.6, and the 95% Confidence Interval was 37.1 to 40.1. For 2020 Spring, the estimated percent was 22.8, and the 95% Confidence Interval was 21.8 to 23.8. For 2020 Fall, the estimated percent was 28.2, and the 95% Confidence Interval was 27 to 29.4. For 2021 Spring, the estimated percent was 26.3, and the 95% Confidence Interval was 25.2 to 27.5. For 2022 Spring, the estimated percent was 32.8, and the 95% Confidence Interval was 31.1 to 34.6. For 2023 Spring, the estimated percent was 29.8, and the 95% Confidence Interval was 28.7 to 31. The 2030 Target is 34.4 percent. | 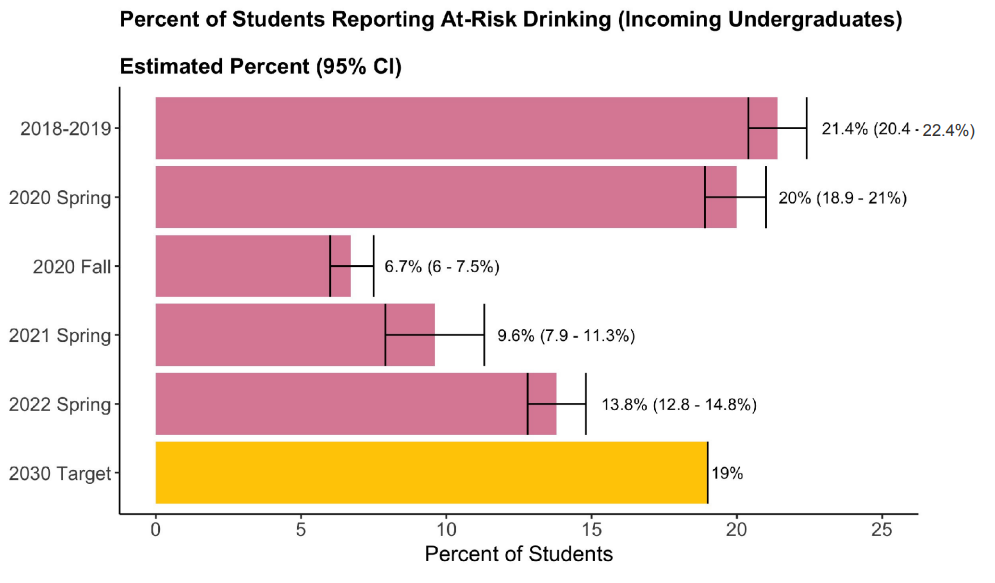 Alt Text: Figure of the Percent of Students Reporting At-Risk Drinking (Incoming Undergraduates), displaying the Estimated Percent and 95% Confidence Interval. For 2018-2019, the estimated percent was 21.4, and the 95% Confidence Interval was 20.4 to 22.4. For 2020 Spring, the estimated percent was 20, and the 95% Confidence Interval was 18.9 to 21. For 2020 Fall, the estimated percent was 6.7, and the 95% Confidence Interval was 6 to 7.5. For 2021 Spring, the estimated percent was 9.6, and the 95% Confidence Interval was 7.9 to 11.3. For 2022 Spring, the estimated percent was 13.8, and the 95% Confidence Interval was 12.8 to 14.8. For 2023 Spring, the estimated percent was NA, and the 95% Confidence Interval was NA to NA. The 2030 Target is 19 percent. |
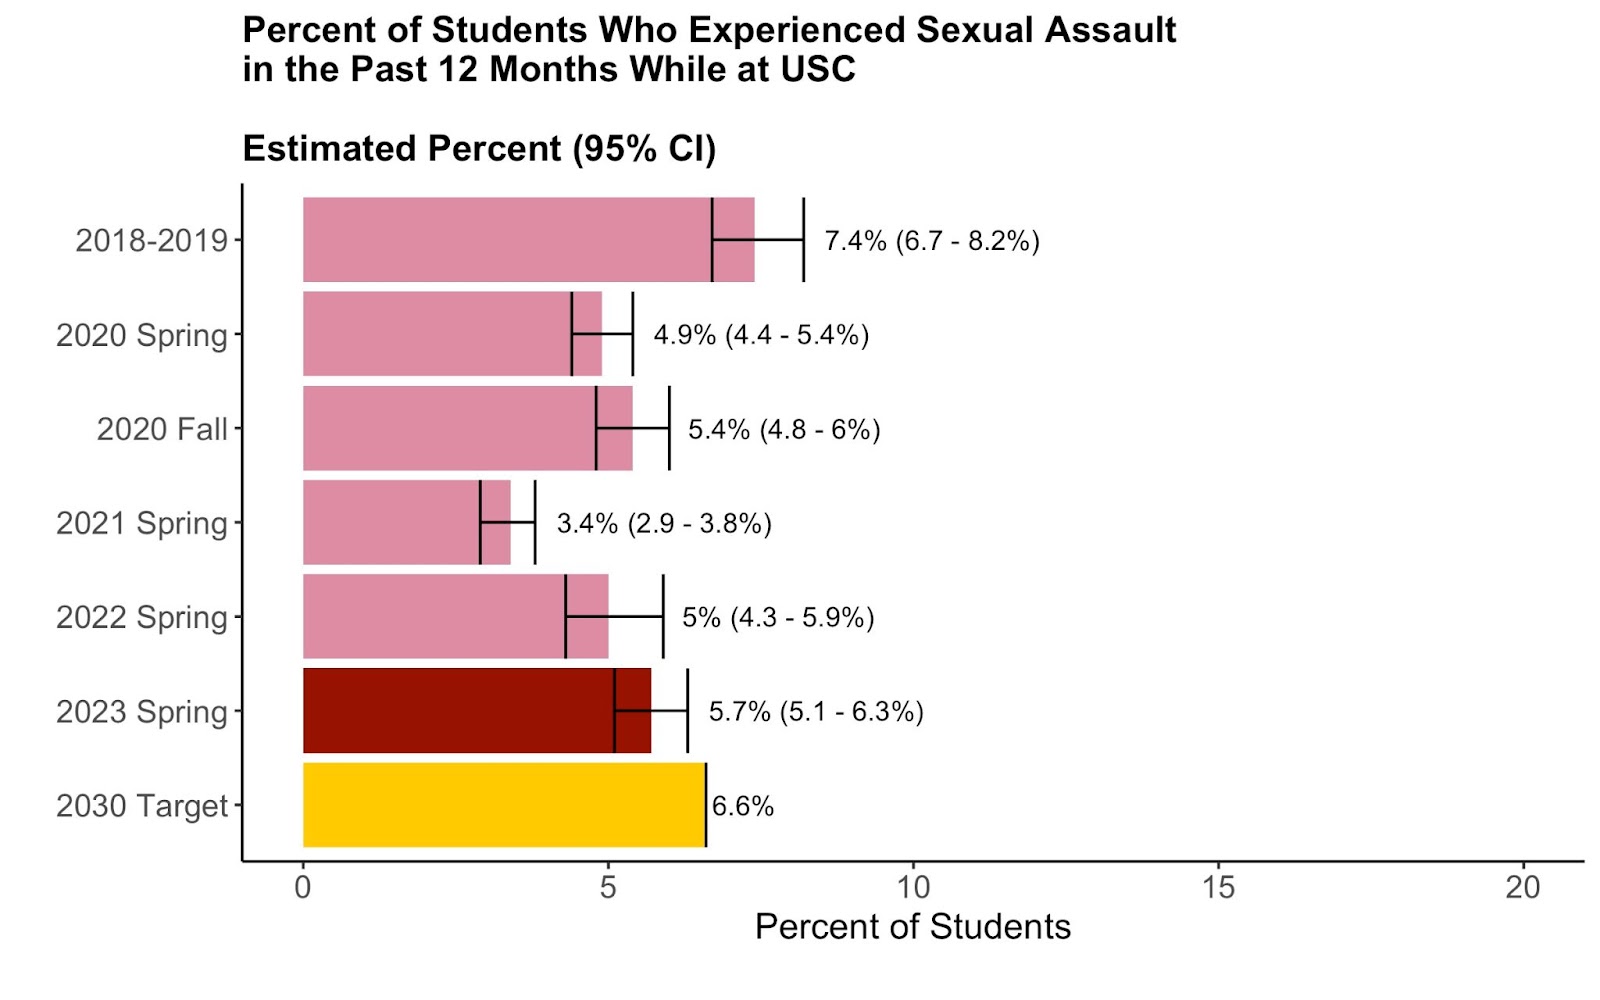 Alt Text: Figure of the Percent of Students Who Experienced Sexual Assault in the past 12 months while at USC, displaying the Estimated Percent and 95% Confidence Interval. For 2018-2019, the estimated percent was 7.4, and the 95% Confidence Interval was 6.7 to 8.2. For 2020 Spring, the estimated percent was 4.9, and the 95% Confidence Interval was 4.4 to 5.4. For 2020 Fall, the estimated percent was 5.4, and the 95% Confidence Interval was 4.8 to 6. For 2021 Spring, the estimated percent was 3.4, and the 95% Confidence Interval was 2.9 to 3.8. For 2022 Spring, the estimated percent was 5, and the 95% Confidence Interval was 4.3 to 5.9. For 2023 Spring, the estimated percent was 5.7, and the 95% Confidence Interval was 5.1 to 6.3. The 2030 Target is 6.6 percent. | 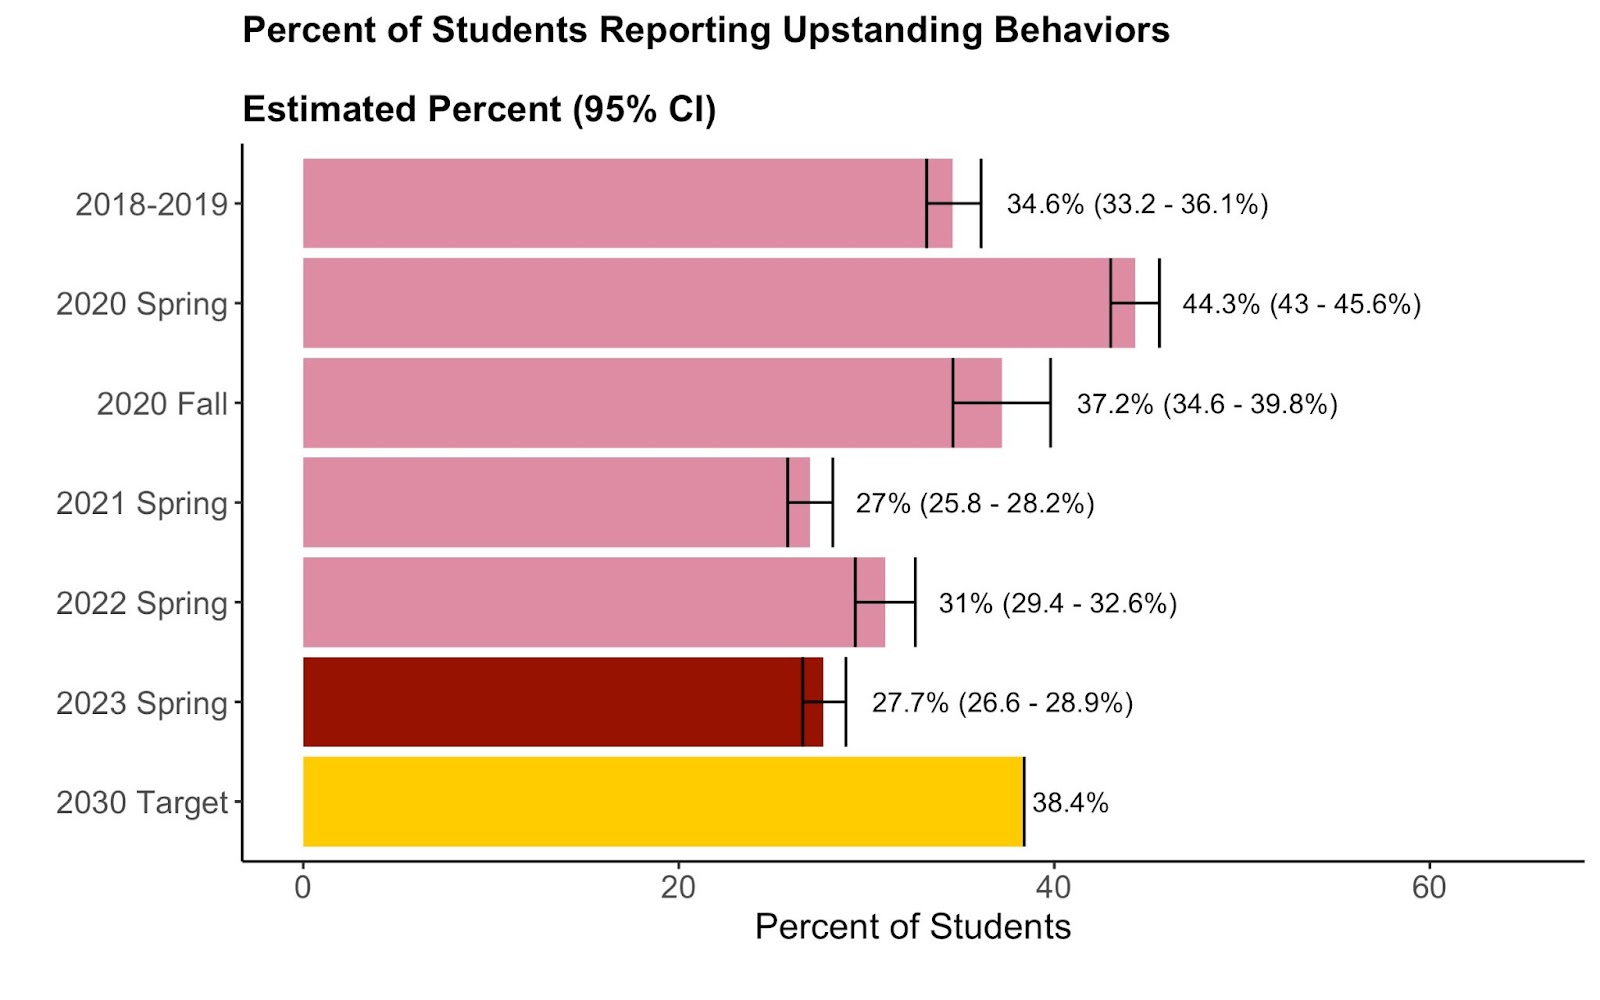 Alt Text: Figure of the Percent of Students Reporting Upstanding Behaviors, displaying the Estimated Percent and 95% Confidence Interval. For 2018-2019, the estimated percent was 34.6, and the 95% Confidence Interval was 33.2 to 36.1. For 2020 Spring, the estimated percent was 44.3, and the 95% Confidence Interval was 43 to 45.6. For 2020 Fall, the estimated percent was 37.2, and the 95% Confidence Interval was 34.6 to 39.8. For 2021 Spring, the estimated percent was 27, and the 95% Confidence Interval was 25.8 to 28.2. For 2022 Spring, the estimated percent was 31, and the 95% Confidence Interval was 29.4 to 32.6. For 2023 Spring, the estimated percent was 27.7, and the 95% Confidence Interval was 26.6 to 28.9. The 2030 Target is 38.4 percent. |